


The Endurance Diet's Diet Quality Score (DQS) System
For assessing how one's diet is doing relative to principles of the Endurance Diet
The following graphics show how the Endurance Diet assigns points to servings of foods in its various food groups, to be tallied each day. Not all foods, and multiple servings of it per day, are rated equal , though most of the poor quality foods get a maximum deduction of 2 points on an integers points scale from -2 to +2, no matter how many servings is had per day. It could be argued that the penalties should be come more severe with more servings, but the totals will be detrimental enough to the daily score that the point will still be well made.
SubStack, the platform this post is on, isn’t very table-friendly to display the actual tables in HTML so my apologies for having to revert to presenting the scheme via graphics. Hopefully, they are detailed enough to be read easily on even small devices like smartphones.
DQS Points by the Serving
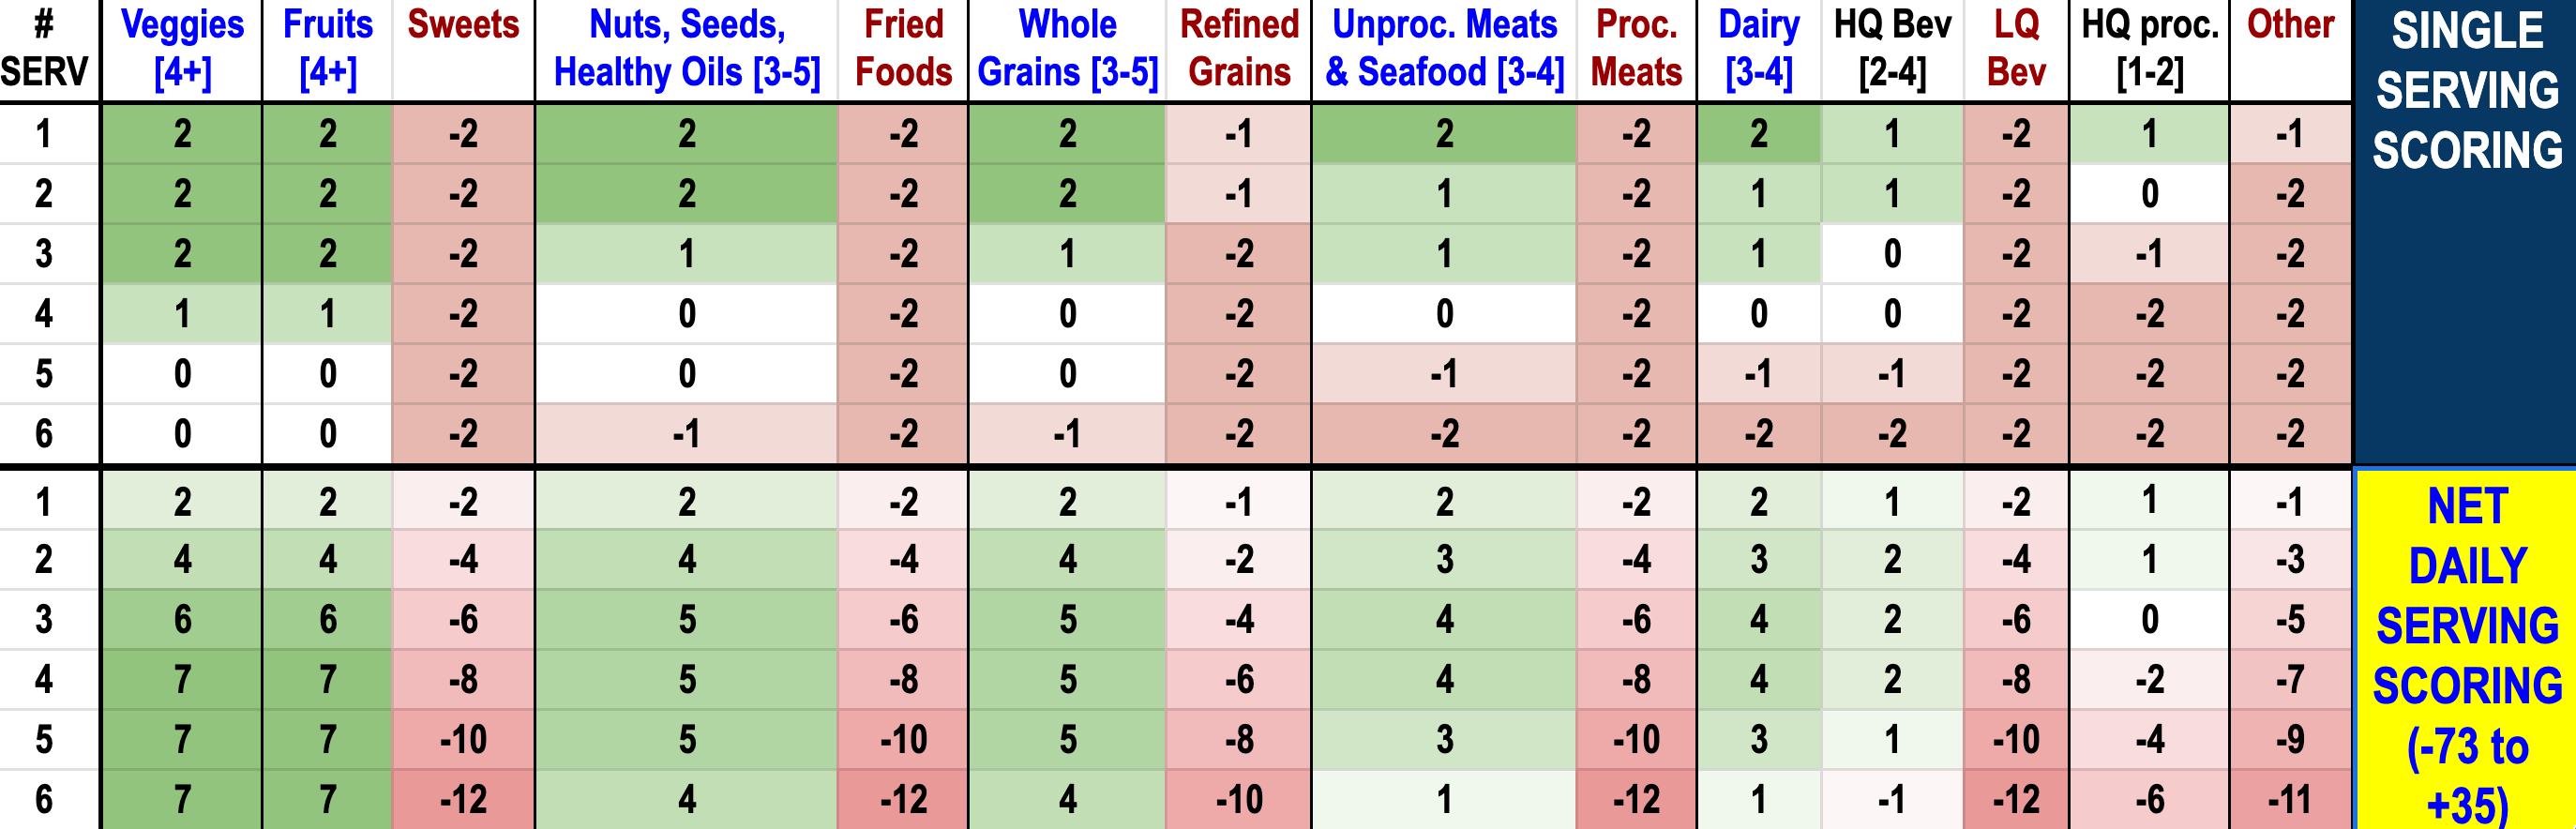
The following two tables show the points assigned for progressive servings of all the food groups in the top half, with a cumulative total in the bottom half.
The number ranges at the top with each good food group name tell you how many servings you can have of that food group per day before you max out the number of points you can get from it each day, or before you start getting penalized for it.
The top half shows that you max out points for most good food groups daily at 3 or 4 servings, with fruits and vegetables earning you the most points among the good food group without penalties. With other good food groups, you will incur penalties for consuming too much of it on any given day. This is the chart you will want to look at to see what benefits or penalties the next serving you have of something each day will do to your score.
The bottom half shows the cumulative scores for various numbers of servings. This is the chart you will want to look at with your total servings, to see how many points you got or got penalized for them, so you won’t have to add all the individual serving points to tally them.
My Refined DQS System
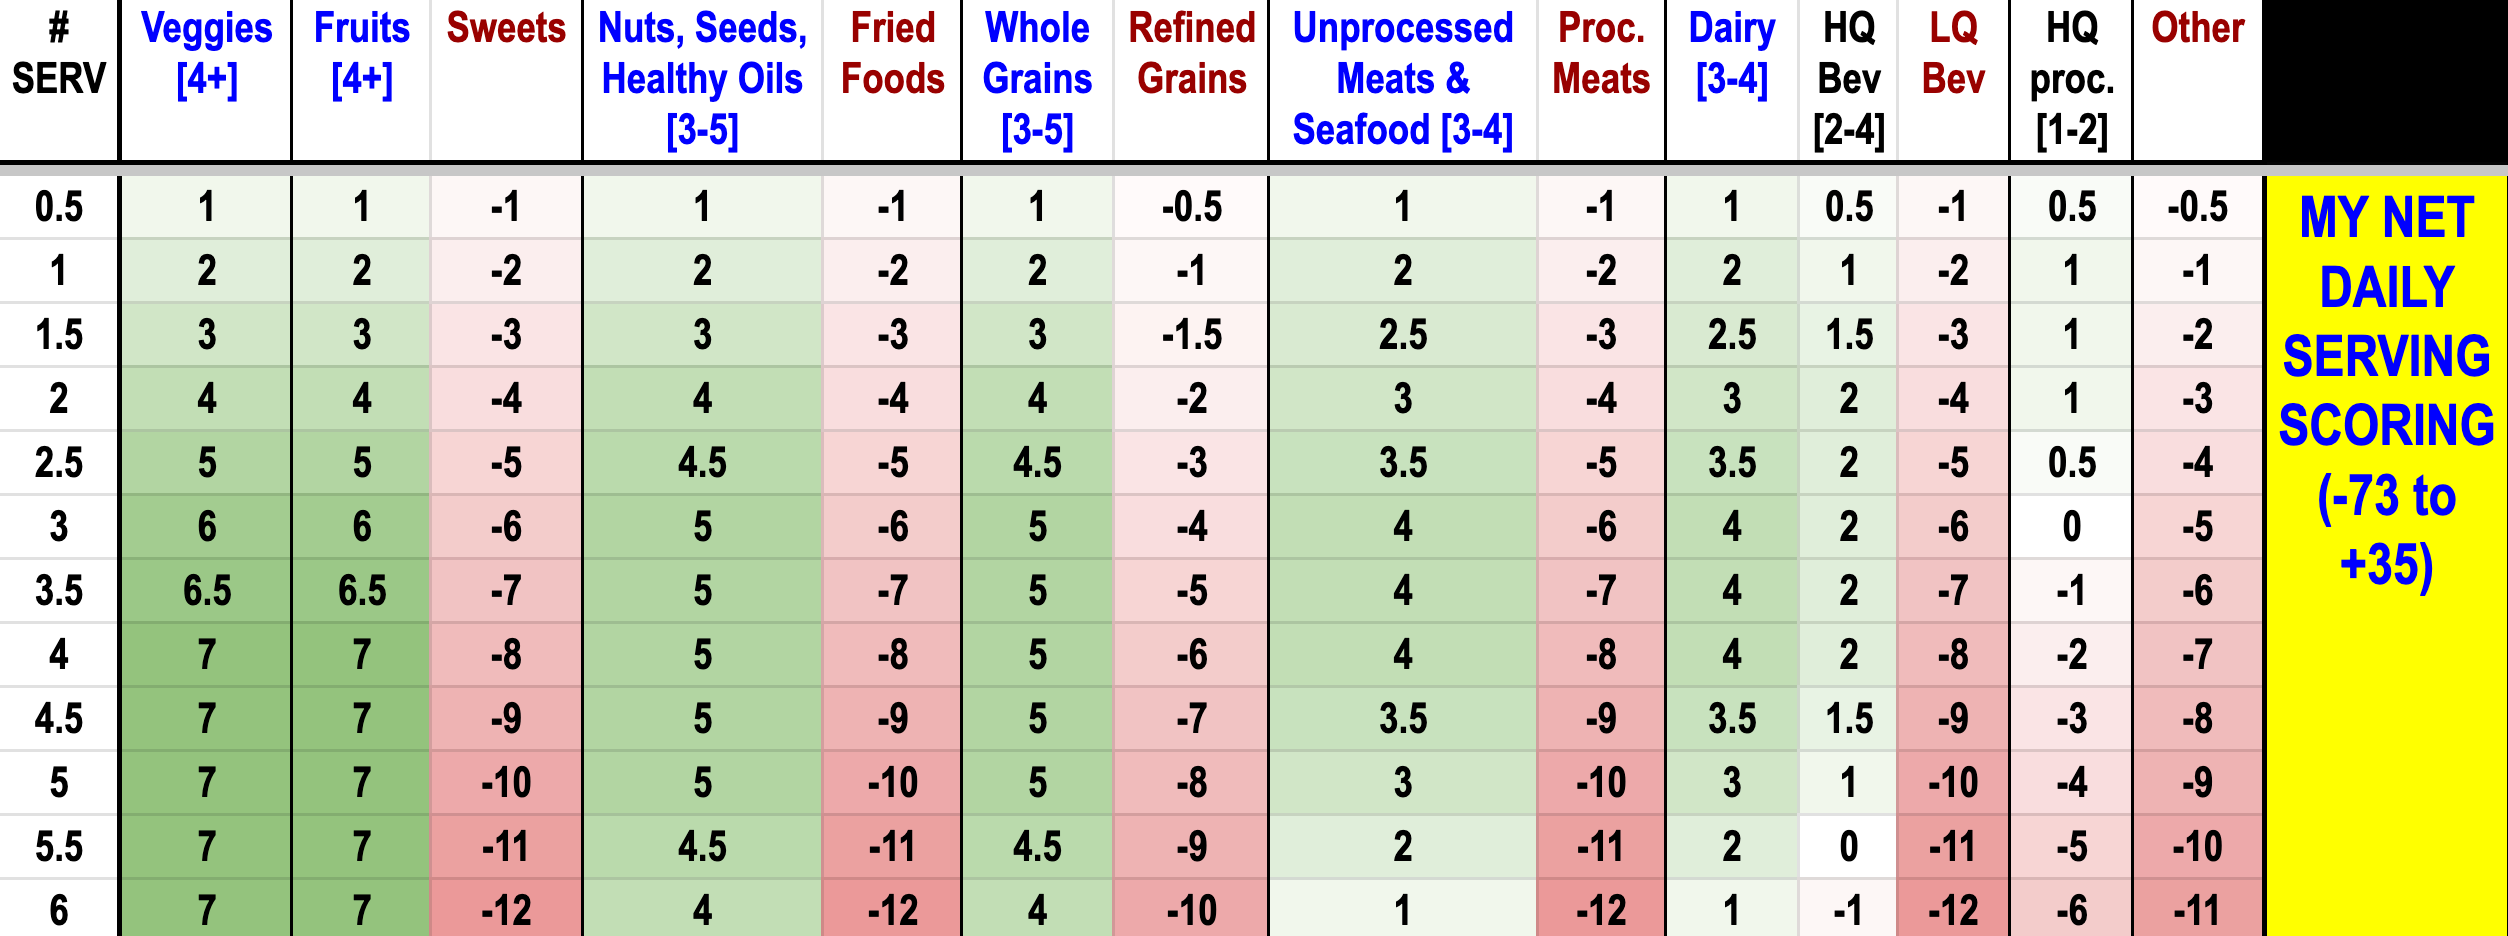
I don’t have any scientific disagreement with the DQS. I shouldn’t since I wouldn’t have any evidence to disagree with it. However, I was disappointed that it didn’t cover half servings since full servings are big enough that we can consume half servings regularly, and should be compensated fairly for it. Fortunately, the DQS’ integer scoring system allows for half points, or sometimes even whole points if 2 were award for an additional serving, so that the math doesn’t get too messy with long decimals when interpolating for points between full servings listed in the table above.
Below is my version of the bottom table above, where you can tally points by the half servings. I just merely took the mid-value between points for full servings to create values for half servings. As you can see, there aren’t actually that many decimals to deal with, and I find it very practical to have for use because many foods I consume are in half serving quantities, not full servings. I would lose out on a lot of points using the table above prescribed from The Endurance Diet book!
NEXT POST
In the next post, I will go over my early experience with the Endurance Diet and Diet Quality Score system so far, sort of as a first progress update.